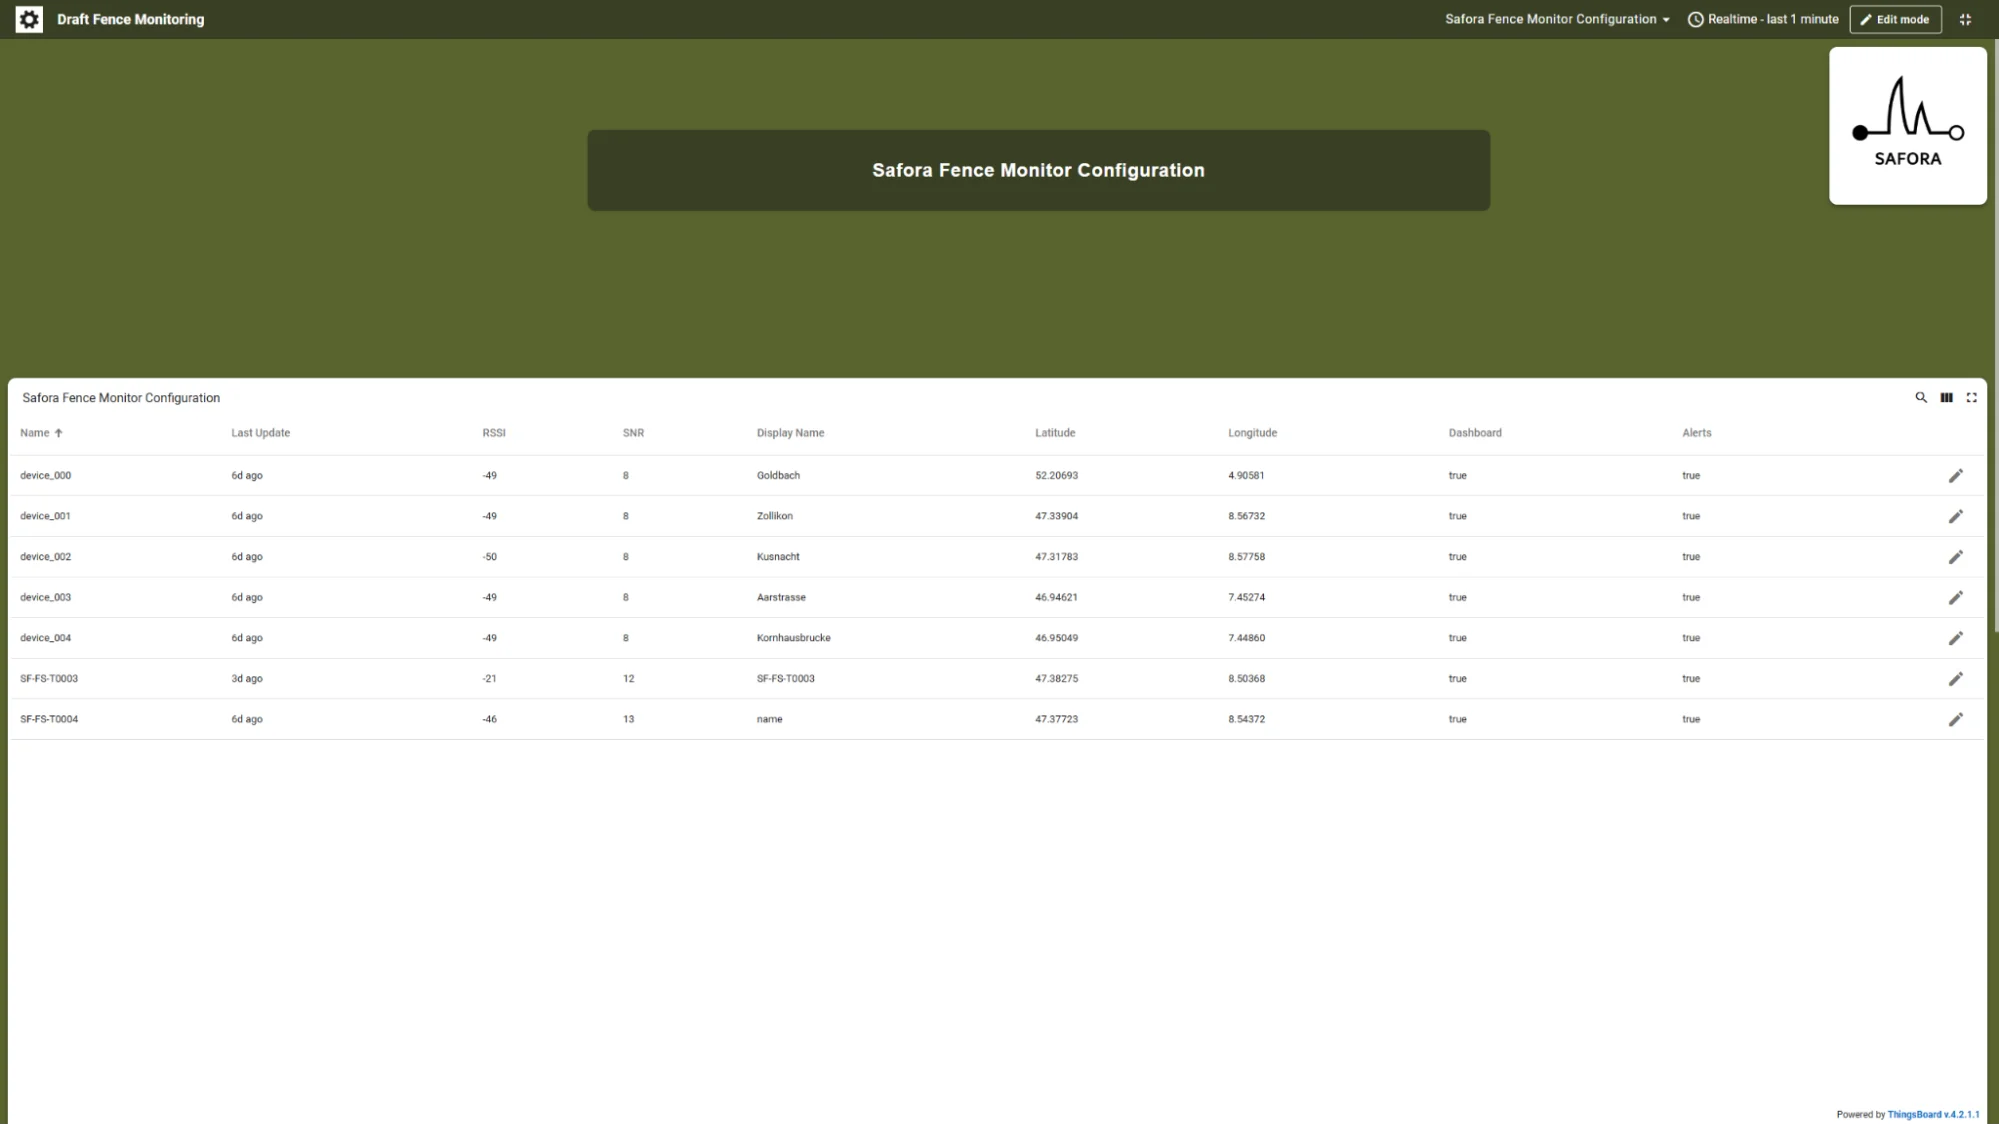
Dashboard Overview
The Safora dashboard has two views, both accessible at dashboard.safora-tech.com:
| View | Purpose |
|---|---|
| Safora Fence Dashboard | Monitor your devices in the field |
| Safora Fence Monitor Configuration | Register and configure data for each device |
Your dashboard login credentials were sent to your shipment email. If you have not received them, contact us at info@safora-tech.com.
We can provide additional accounts with either full access or map-only access, for example for team members who need to monitor devices but do not need to manage configuration. Contact us to arrange this.
Safora Fence Dashboard
Use this view to see active devices on the map and review live status below the map.
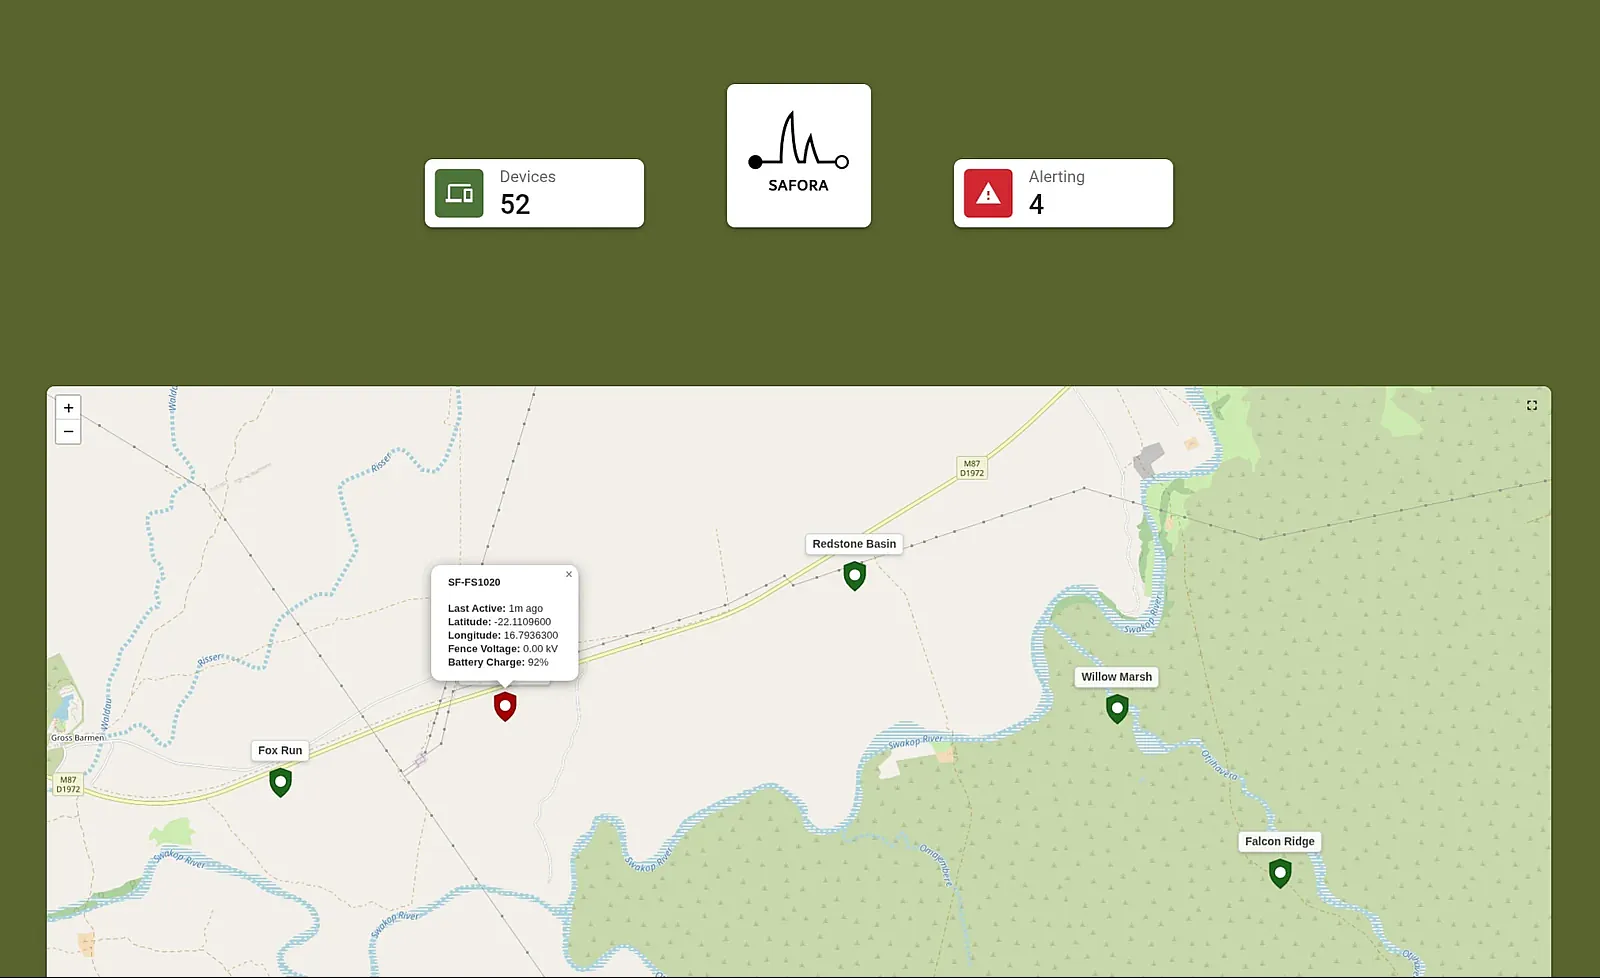
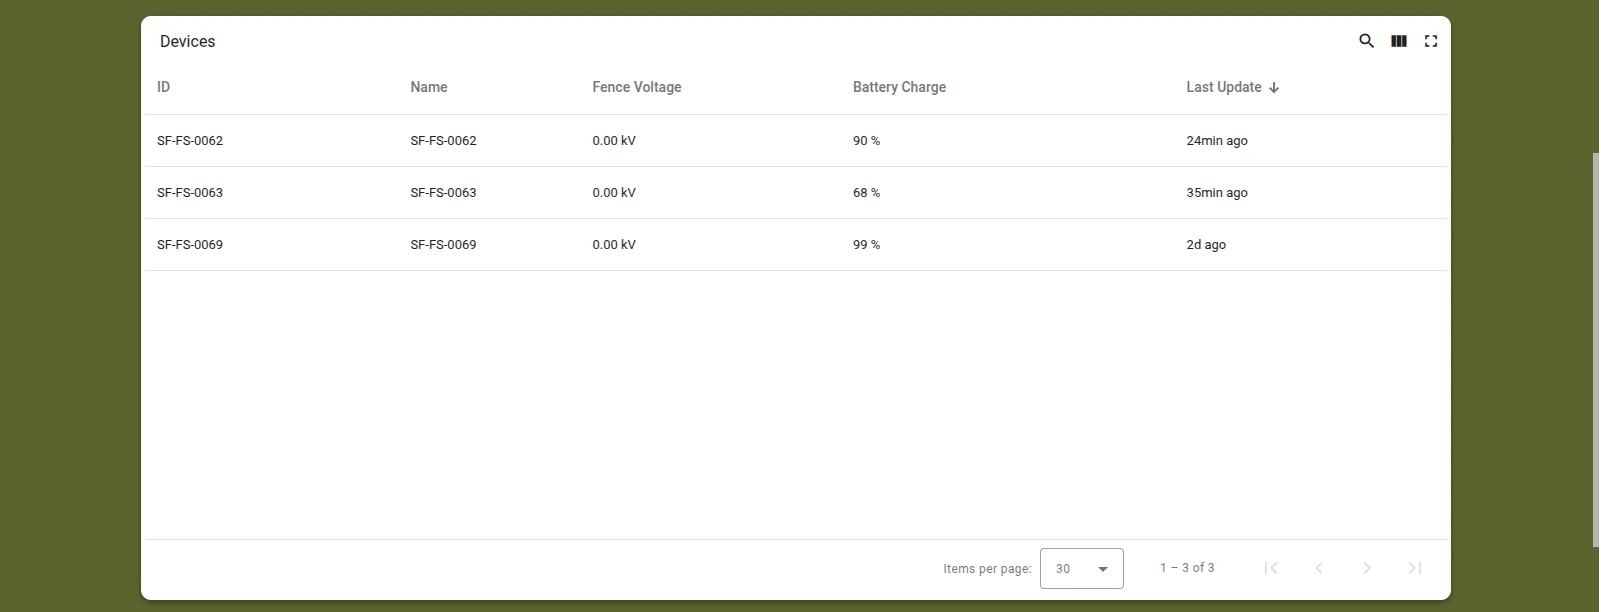
Below the map, a list of your devices shows current measurements and further details for each sensor.
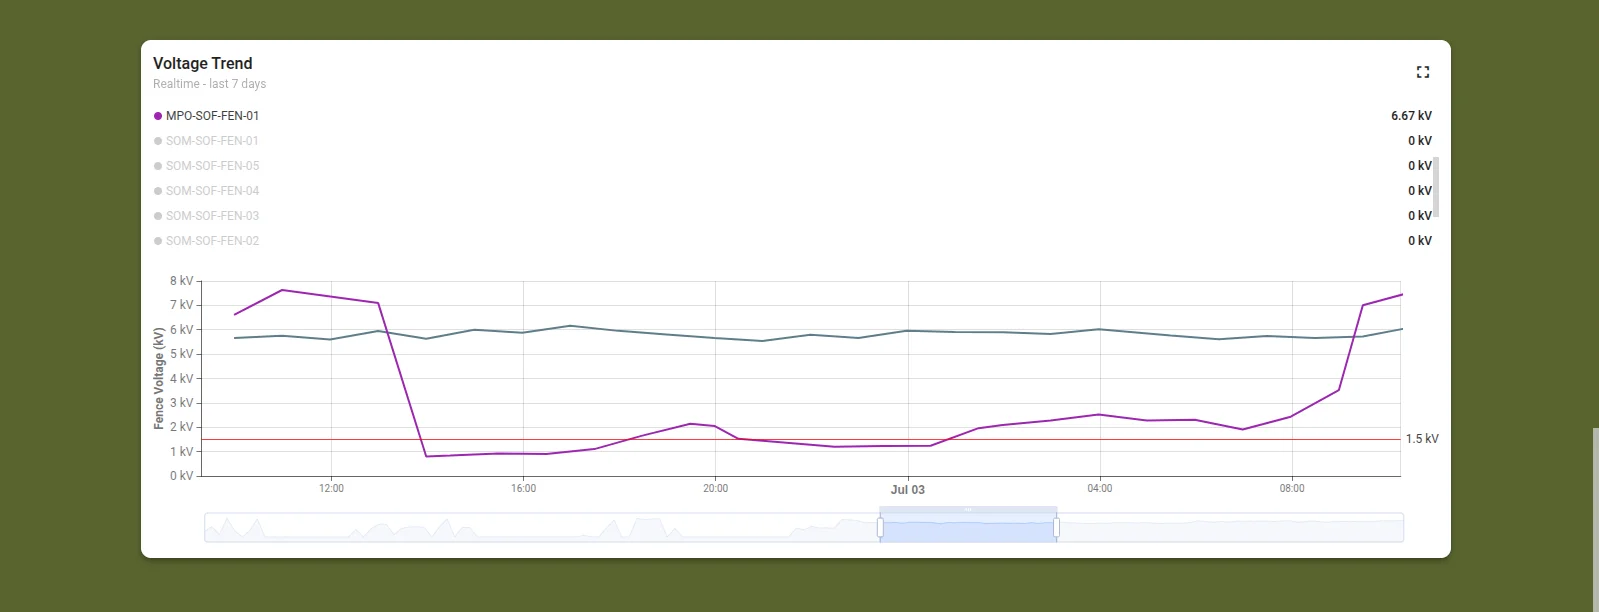
Voltage trend
This is an add-on feature that is not included automatically. Contact us at info@safora-tech.com for more information.
The dashboard can also display a historical voltage plot for each device. Press Realtime under Voltage Trend to configure the range of historical data shown.
Safora Fence Monitor Configuration
Use this view to register devices as they come online and set display names, GPS coordinates, and alert settings. See Adding and Configuring Devices for step-by-step instructions.